
Woodies CCI Indicator
The product of an experienced trader, Ken Wood, this trading tool is regarded as one of the most important trading tools for traders, irrespective of their years of experience in the business. Although the Woodies CCI Indicator was initially designed for DFDs traders, it has been adopted by traders across different trading a wide range of commodities and assets such as cryptocurrency and Forex, thanks to its success as a CFDs trading tool.
A distinct feature of this system is unlike other indicators; it is a complete system and not just a standalone indicator. This implies that traders can use the Woodies CCI Indicator on its own without relying on other technical analysis tools for confirmation. This trading system works on a principle: the direction of the CCI determines price movement. Now let’s see if this one makes our Best Metatrader Indicators page.
Table of Contents
How Does the Woodies CCI Indicator Work?
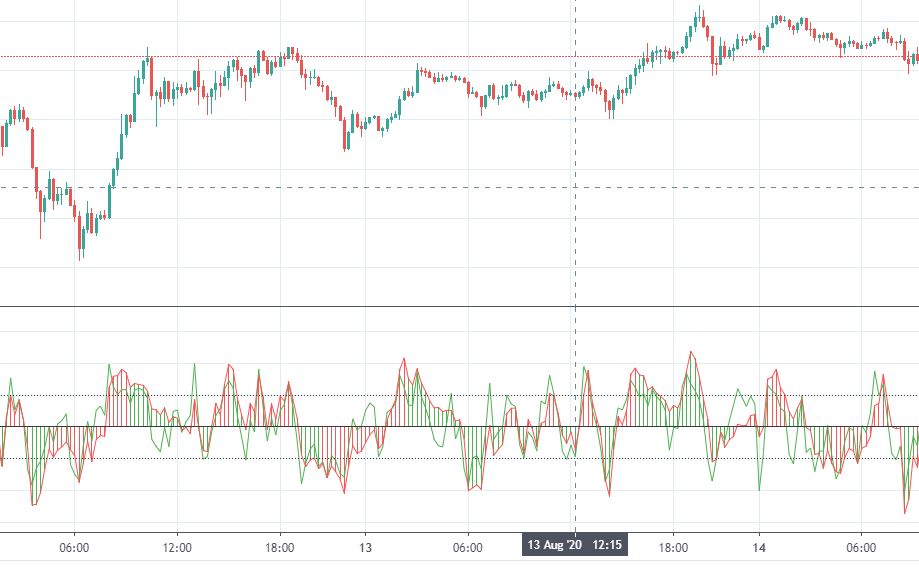
As an independent trading system, the Woodies CCI Indicator consists of five components. These are:
1. Commodity Channel Index:
The Commodity Channel Index is the red lines. They have a more extended period than the CCI Turbo. It is an indicator like an oscillator, measuring the difference between the average price and the price change of a security.
The position of the CCI determines asset prices. When the indicator rises, asset prices are above average but are below average when the indicator is in the opposite position. This makes CCI the most crucial element of the Woodies CCI.
2. CCI Turbo:
The Turbo is the green lines of the trading indicator. It works together with the red lines to achieve its primary purpose of exit points and pattern detection, and not used for trend analysis.
3. CCI Histogram:
The histogram is an essential part of the Woodies CCI Indicator that gives traders an insight into the trading trend. The histogram falls below the zero line for negative trends and above the zero line for positive trends. For an uptrend, the CCI will be above the zero line for a minimum of 6 bars, and the trend is down if the CCI is in the opposite direction for at least 6 bars.
CCI’s past performance determines the histogram bars’ color. For instance, the next bar will turn green if, for the 6 bars, the indicator is above the zero line. While if the indicator is below zero line for at least 6 bars, the next bar will turn green. TIP: Read our lastest price action indicator mt4 article to boost your trading even more.
4. Zero Line:
The zero line is the major part of the system used for indicating support or resistance. If the CCI crosses the zero line without going back for a minimum of 6 bars, this may indicate the existence of a trend. If it crosses above the zero line, an uptrend is indicated. It is a downtrend if it crosses below the zero line.
Sometimes, though, the zero line may work together with Least Squares Moving Average (LSMA) indicator to show traders the condition of the price in relation to the LSMA, specifically whether it is above or below it. Note that LSMA is specifically designed to calculate moving average for Woodies CCI Indicator. Hence, the indicator’s red areas show that the current prices are below the LSMA while the green areas signify that the price is above the LSMA.
Note that the zero line is an integral part of the system because it serves as the center of all the patterns on the Woodies CCI indicator. The line represents the system’s major resistance and support in real-time. Thus, you can’t count on it to project future support and resistance. However, note that the patterns will be automatically adjusted to reflect market moves. During a trading day, the zero line is subjected to a series of repeated tests for information.
5. Support/Resistance Lines:
There are three support and resistance lines in the Woodies CCI Indicator. These are the zero line, the main resistance and support level, +/-100, representing the minority resistance and support level, and +/-200, the oversold and overbought areas. It is overbought if the value is +200 and higher and -200 and lower implies oversold.

How to Use the Indicator in Trading
Woodies Indicator provides some trading signals that traders can use for trading. These are:
1. Reverse Divergence
Also known as hidden divergence, the reverse divergence is the reverse or opposite of the standard divergence. It occurs when there is a new swing low in the price while the oscillator makes a higher low divergence. Many traders consider this as bullish. Hence, they also refer to it as bullish reverse divergence.
The reverse divergence trades are the preferred option for most traders who consider them more reliable than the standard divergence trades because while a standard bullish divergence doesn’t form in the trend’s direction, the bullish divergence does. The Woodies CC indicator works also good with a premium price action indicator.
2. Zero-Line Reject
A zero-line reject pattern (ZLR) indicates when the CCI bounces off near or off the zero line. This can happen anywhere from -100 to +100 for short and long trades, respectively. This pattern shows you the best time to invest in dips and sell off the pullback.
3. Horizontal Trend Line Break
You may consider a new deal when if there are two CCI troughs or peaks on the same level close to +/- threshold. You are advised to use the signal with caution, though. This is because the signal is a bit tricky. After all, the signal it produces may work in either direction: it can be in the direction or against a prevailing trend. Nevertheless, keep your eyes on it because it can provide a piece of useful trading information.
The Woodies Indicator should be an essential component of your trading toolbox. It will contribute massively to your trading success if you follow the provided trend and make judicious use of such a piece of information.
This trading platform doesn’t focus solely on Woodies CCI Indicator as the only trading tool. It also offers an array of other trading tools you may check out to improve your trading skills significantly and increase your chances of making profitable trading.
Conclusion On Woodies CCI Indicator
As a complete system, the Woodies Indicator is designed to help you become a better trader. Taking full advantage of its features, you have what you need to trade like a pro.
You are not limited to this tool on the trading platform. There is a list of other trading tools that will boost your trading skills if you check them out on our best forex indicator blog.