
How To Use The Price Action Indicator In The Accurate Way
When it comes to trading strategies, doubtlessly, the price action trading strategy is the go to one that can be relied upon. Once you figure out how to use price action, the knowledge will often improve your profit-making potential and your trading skills. Plus, you will know how to read trading charts without stress. However, if you check on the internet or you simply Google “price action,” there is a lot of half-truths and misinformation in circulation. And therefore, Price Action Indicator could be very handy.
To put the record, we decided to put this article together so that new traders (and even experienced traders) that just joined the forex space can make the most out of this trading concept. At its very core, price action can be described as the price movement of security plotted over time. The price action forms the basis of all technical analysis known to forex, stock, commodities, and options traders. Many scalpers rely heavily on price action to make a trade decision.
With a Price Action Indicator, you can get your act right using this strategy to trade the forex market. An indicator is a tool that comes handy to help traders automate the process of reading and studying different trading charts for price movements.
So, we encourage you to read till the end to find out how to use the indicator the right way and see if it makes our best metatrader indicators list.
Table of Contents
What Is The Price Action?
The Price Action is a custom technical indicator built for traders using the popular MT4 trading terminal. The indicator helps traders to see, in real-time, a security’s price movements that make up the individual candles on the right, regardless of the timeframes.
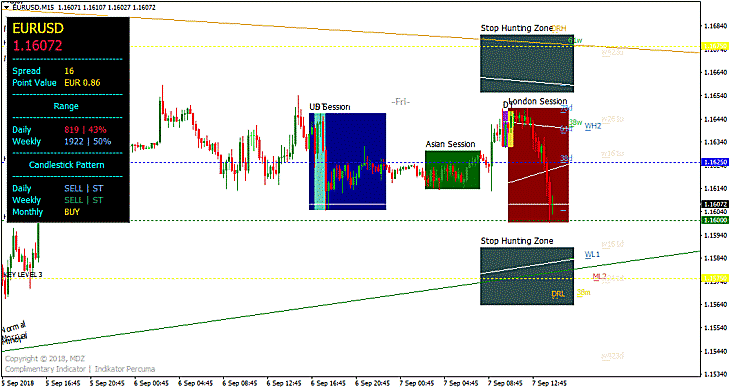
Take a look at the EUR/USD 15-minute chart below; you will see that the indicator has the following features:
WATCH THE PREMIUM PRICE ACTION INDICATOR VIDEO BELOW:
#1. Mini Dashboard
There is a mini dashboard on the indicator’s interface, as seen in the screenshot above. The dashboard gives information such as the current quote, currency pair name, daily range, point value, weekly range, as well as the candlestick pattern of the chart.
#2. Trading Sessions
You can also see the past and present trading sessions demarcated by different colors (London session, Asian session, and US session)
#3. Trend Lines
The Price Action Indicator mt4 shows different trend lines on the market. Whether it’s a major or minor trend line, you will see it on the indicator’s interface.
#4. Fibonacci Retracement Levels
The indicator also displays the Fibonacci levels for the daily, weekly, and monthly timeframes.
#5. Stop Hunting Zones
Lastly, the price action shows the stop hunting zones to buy and sells trades. You can modify the indicator’s settings from its input menu.
How To Install/Remove The Indicator Price Action
If this is your first time downloading and installing this indicator, you should be the least concern. Here we will facilitate you on how to download and install it without breaking a sweat.
With following the simple steps, you can install this tool without any hassle. Here is how to go about it:
1. Download the indicator file from a trusted source
2. Save the downloaded file in a folder you will easily remember when you need it
3. Move the downloaded file to your MetaTrade4 Indicator directory folder
4. Restart your MT4 trading terminal and select the chart you wish to install the Price Action Indicator
5. Head to the MT4 indicator directory folder where you moved the downloaded file to
6. Look out for the price action file
7. Right-click on the file and select “Install.”
8. Adjust the settings of the indicator for efficiency sake (we would explain this further in the next section)
9. The indicator should appear in your trading chart.
If you don’t need the indicator again, you can remove it from your trading chart following the steps below:
1. Launch your MT4 trading platform
2. Head straight to the Indicator Directory folder
3. Look for the Price Action Indicator file.
4. Right-click on the indicator and select “remove/uninstall.”
5. The indicator should disappear from your trading chart.
Basic Entry And Exit Strategy
The entry and exit strategies of the Price Action are very simple to understand – follow the steps below:
1. Buy strategy: When the indicator shows strong buy signals lines, open a buy trade entry with good volume size. However, before you trade, apply the stop loss for short or long-term as you deem fit.
2. Sell strategy: When the indicator shows strong sell signals, open sell trade entry with Breakout level in any currency.
3. Time Frames: 1-minute, 5-minute, 15-minute, 30-minute, 1 hour, 4 hours, 24 hours, Weekly, and Monthly.
How To Use The Price Action
It is easy to use the Price Action tool. It can be used in different ways:
1. First, traders can use it to trade the major trend lines. The rule for trading major trend lines is to place a buy order when an upper trend line is broken or place a sell order when the price of the asset falls below a lower major trend
2. Secondly, you can use the indicator to trade Fibonacci retracement levels like the 38.2% level. Here’s the rule for trading Fibonacci retracement levels: wait for a pullback to the 38.2% level during up trending markets. Then look to buy at that level. Similarly, during down trending markets, you need to wait for a pullback to the 38.2% level, and then look to sell at that level.
Final Thoughts On Price Action Indicator
And that’s a wrap for the Price Action tool. As you can see, price action strategy is at the center of forex trading. Therefore, any trader that doesn’t know how to trade forex price action would constantly be losing money to market forces. This indicator can help traders to detect the price trick of any currency pair automatically. It is also a valuable tool for scalpers who take profit before the end of a trading session.
Before you start using the indicator, we advise that you first apply it with a demo account. This way, you will learn how the tool works, the perfect timeframes, and your confidence level will increase without being at risk of losing your hard-earned money.
Lastly, there are a couple of technical indicators on our best forex indicator website; you can combine with the price action to further enhance your profit-making skills. However, bear in mind that no indicator is 100% efficiency, except when you combine two or more indicators in a single trading chart.