
Application of Wave Trend Oscillator to Trading
The trader is always on the lookout for the most efficient trading to adopt in his business; one that promises good profit and which protects his funds as well. A trading tool with extensive functionality is always an advantage to the trader. This is what the Wave Trend Oscillator brings to the table; reliability and wide range of performance with the ability to combine the function of a trend tool and an oscillator. In this article you can discover if the Wave Trend Oscillator will make our Best Metatrader Indicators page or not.
Table of Contents
Wave Trend Oscillator Explained.
The Wave Trend Oscillator sometimes referred to as Wave Trend Indicator is a technical indicator that combines the functions of two technical tools. It recognizes the opening or closing of a new wave trend movement, and as an oscillator, it can recognize the overbought and oversold zones.
The Wave Trend is founded on a Simple Moving Average and an Exponential Moving Average with critical level.
WATCH THE TRENDVIPER MT4 INDICATOR VIDEO:
Essential Points to Note
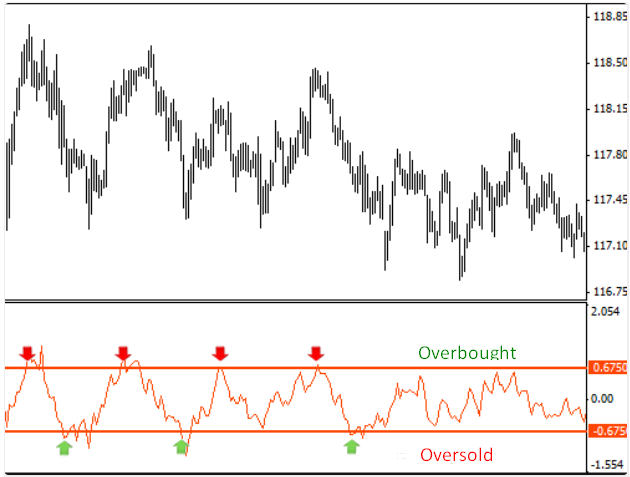
• The indicator key levels are in the range of -50 and 50. When a dot is painted between levels -50 and -60, it denotes a buy signal, whereas if the dot hovers between 50 and 60 it represents a sell signal. The signal is said to be stronger when the indicator goes below -60 or higher than 60, a situation that seldom happens.
• Immediately after the dot is painted, the indicator lines head outside the zone. After that, one or two bars cross the level and go to zero level.
Applying the Wave Trend Indicator in Trading
When applying the Wave Trend indicator to trading, it is essential to note that a trading signal happens at the point where fast and slow-moving averages cross paths. When there is a line of intersection in the zone of oversold, and a blue signal point appears on the indicator, it is a signal to buy. We can open the transaction on the accompanying bar.
Conversely, to sell, you look out for when the lines cross paths in the overbought zone turning the indicator from top to bottom on the indicator line, with a red signal appearing. We can open the transaction on the accompanying bar. You can combine this indicator also with a good elliot wave indicator mt4 to improve your trading.
If you examine the chart below cautiously, you will observe that the times the Wave Trend Indicator produced a buy or sell signal at the point of intersection between the two lines. The buy in green is marked with a horizontal line, and the sell in red is marked with an arrow at the exact point where the signal occurred on the chart.

Points of Interest when Trading with this Indicator
1. Defining the period of flat reliably.
2. Anticipated signs of a turn.
3. A likelihood of input the opening of another a new trend.
4. The strongest buy signal is indicated at the point where a solid green line intersects the red-spotted line under the horizontal green line.
5. The strongest sell signal is indicated at the point where the green line intersects the red dotted line above the horizontal red line.
Overbought and Oversold market Explained

1. An overbought market represents a condition when a price has peaked at the highest point. The request for an underlying asset has been fulfilled. Consequently, the price is about to drop.
2. Conversely, an oversold market is a complete opposite. It refers to a situation when a price has hit its bottom point and cannot drop any lower.
Trading Strategies Based on This Indicator
The Wave Trend Indicator is mostly used as the leading trading indicator; although it is quite risky, so it becomes crucial to get your strategies right.
Advanced indicators can be used without any extra filters because of its narrow range application. It is best to use oscillators in combination with trend indicators:
1. Using Wave trend as a single trading tool.
2. As a principle, it is better to use two indicators instead of one.
Entering a Long Trade:
1. You can trade during the European session.
2. The Wave trend Oscillator paints a yellow dot bordering level 60 but not below level 50.
3. In the maximum of the next 5 hours, the Wave trend drops and paints a blue dot as close level -60 as can be expected but not higher than level -50.
4. The lines joining these dots look comparatively straight with no noticeable local extremes.
Immediately after the blue dot, you may enter a trade at the next bar. The earmarked profit is usually not high, 10 pips will be enough. A stop-loss is also put at a reasonably short distance of not more than 10-20 pips.
Entering a Short Trade
1. You can transact during the European session
2. The Wave trend paints a yellow dot near level -60 but not more than level -50.
3. In the next maximum of five hours, the Wave trend rises and paints a blue dot as near level 60 as possible but not less than level 50.
4. The lines between these dots look relatively straight without obvious local extremes.
The requirement for entering a trade is pretty much the same as that of a long trade.
Adopting Wave Trend & Trend Cycle
As noted in Elliot’s wave theory, the market is cyclical; a rise accompanies every fall. Conversely, every rise is followed by a fall. However, this is a very delicate situation because it is essential to distinguish between a temporary correction and a period of reversal. It is ideal to combine the Wave Trend Indicator and the Cycle Koufer Extremus, which helps to trace the end of wave trends. So you see having a trend indicator MT4 is a super handy tool!
Entering a Long Trade
1. The Cycle Koufer Extremus paints a dot between levels 0 and 15. The nearer it is to zero level, the more preferable.
2. The Wave trend paints a blue dot as low as could reasonably be expected. The fundamental condition is that is must be underneath level – 50 as low as possible, near level – 60. This relates to the situation when the green bull line gets through the red bear line upside.
Extra requirement. Carefully look at the pattern of Wave trend for the preceding 10 bars. It should not have been underneath – 50 with painting a blue dot. If both conditions were fulfilled concurrently and the wave trend painted dots a couple of bars prior, you do not enter a trade.
However, you can enter a trade at the following bar. The earmarked profit relies upon the circumstance. The system permits you to garner the movement of the wave trend equivalent to around 20-30 pips. You can set the stop loss at about equal distance, alluding to the confined lows.
At the point when the earmarked profit is attained, you observe the market conditions. If the trend continues after that, you protect the trade by a trailing stop. On the off chance that there are any indications of a reversal, you close the whole position. If the price has not yet been attained at that target level, you exit the trade prematurely.
Entering a Short Trade:
1. Cycle Koufer Extremus should paint a dot between levels 85 and 100. The nearer it is to level 100, the preferable.
2. The Wave trend paints a yellow dot as high as could reasonably be. The fundamental requirement is that it should be beyond level 50 as high as could be reasonably expected and close to level 60. This should be similar to the case when the green bull line breaks through the red bear line downside.
You should also examine the previous 10 bars before the signal; the Wave trend is not expected to paint a yellow dot between levels 85 and 100. Entry and exit concepts are identical to those of a long trade.
Final Words On Wave Trend Oscillator
If you are searching for an excellent trading tool that is reliable and proficient in dispensing the right information about the market trend, then the Wave Trend Oscillator is it!
Although some argue that the Wave Trend sends a lot of false signals in a trending market, it is not valid. Naturally, as with other indicators, there can be errors, but if you notice some inconsistencies during the testing of historical data and adopt additional supplementary tools, it can yield a far better result.
Additionally, you can find more tools and indicators on this platform through this link. So look at it now and add more comfort to your trading.