
Trading through VWAP Bands
A business as technical as Forex requires traders to be able to get it right at all times in terms of strategies. The essence of this is to increase profitability and minimize loses. Although there is a mind-boggling number of specialized Indicators which are accessible for Forex and stock traders to choose from, in a lot of cases, they always come short of expectation. VWAP Bands are one of the most under-utilized packages available to traders.
It is a moving average dependent not just on volume, but based on price. It gives you an idea of where more people are engaged and involved. When rightly combined with other indicators, it has tremendous advantages over what the traditional moving averages have to offer, mostly in the area of improving the accuracy of your trading strategy.
Table of Contents
What are the VWAP Bands?
The VWAP Bands is used to refer to the ratio of the value of shares traded to total volume. VWAP is adopted as a standard benchmark for intraday trading. It is meant to capture the average mean of prices paid by traders for a specific security.
The Pros & Cons
VWAP has gained popularity as an execution algorithm that most brokers recommend to managers. The profile of VWAP is usually U-shaped, with a predominant amount of the execution occurring near the open and close.
Pros
1. The approach on VWAP is quite simple, easy to calculate and understand. With VWAP, traders can determine the best price to buy and sell security while being mindful of the volume of the market.
2. Volume Weighted Average Price is especially useful in a trade involving a large volume of shares.
3. VWAP has full acceptance among traders globally because it is simple to use and the promises it holds to succeed.
4. It is also useful in small trade evaluation.
Cons
1. VWAP is a lagging indicator; therefore, if you try to use it for more than one day, it will not be able to indicate the correct tend. Consequently, it should be used only for intraday.
2. Furthermore, there are cases where individual stocks or even the market are in an intense bullish phase. Consequently, there will be no cross-over for the entire day, which, in turn, presents very insignificant data to the traders as well as institutions.
3. To a certain extent, one major demerit of using VWAP is that as a result of not being used beyond a day; it is not able to provide much information from a historical point perspective.
Important Observations to note about the VWAP
1. On bullish trend days, the market stays mostly above the VWAP.
2. On bearish trend days, the market stays mostly below the VWAP.
3. During ranging sessions, the market stays mostly around the VWAP, which remains more or less flat.
From the observations above, one can deductively say that the VWAP has excellent potentials for helping traders identify the market tide.
Description of Volume Weighted Average Price (VWAP)
The Volume Weighted Average Price is like a moving average, except for volume, which is incorporated to weight the average price for just one-day time frame. VWAP is adjusted every day and can be determined depending on the type of trade. You can as well apply standard deviation bands above and underneath the VWAP.
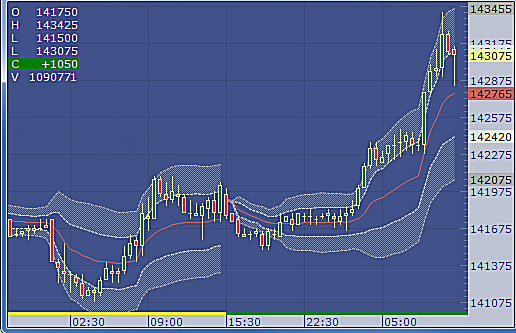
In the model underneath, the VWAP line is red with two standard deviations bands above and beneath; the region has been carefully spotlighted.
The formula for VWAP Computation
1. PVWAP = Volume Weighted Average Price
2. Pj = price of trade j
3. Qj = quantity of trade j
4. j = each trade that occurs at a specific time frame.
To obtain the standard deviation value to situate the upper and lower channel lines apply the formula below:
Mid Band = Pvwap
Upper Band = Mid Band + (x) Standard Deviation
Lower Band = Mid Band – (x) Standard Deviation
Note: For the VWAP standard deviation figuring, X speaks to the VWAP esteem determined at each bar and x is the normal of the VWAP since the meeting start. The standard deviation will be zero on the first bar of every session since (xi – x) will be zero, and N is one.
Additional Bands:
1. Price Different Standard Deviation: This is a kind of Band that ascertains the farthest distance that happens between the Volume Weighted Normal Cost. And the High or Low of each bar that takes place between the Volume Weighted Average Price. As well as the High or Low of each bar to adopt in the standard deviation computation recorded previously.
Example: If the Volume Weighted Average Price was 102 and the high and low are 104 and 101 individually, at that point, the maximum value contrast of 2 would be the xi value. X-bar would be the mean of these differences for all bars in this session.
2. Tick Balance: A computational band type that sums and deducts the number of ticks indicated from the VWAP. It is like a moving average envelope.
Example
How to Utilize VWAP in Exchanging?
Traders use VWAP Bands as help and resistance in a brief timeframe outline. On the specialized side of things, VWAP is determined by including the dollar sum exchanged for each exchange and afterwards dividing by the free offers exchanged for the trading day.
However, brokers usually apply volume Weighted Average Price on the 1 minute and 5-minute chart outlines. Those periods are utilized when day trading because price activity moves rapidly. Hence, dealers like price instability as it brings brisk benefits and heaps of chances on the long or short run.
In case you get in and out of stock rapidly, you have to have an indicator that is going to show you the market direction and assist you in making up your mind on trading choices. That is what VWAP is all about as a quick trading indicator.
Price Activity and The VWAP Trading Approach
The VWAP begins at the value at which a stock opens and goes up or down, dependent on the volume and price activity for the day. VWAP is much more sensitive to the fluctuation of the market at the opening period, but as the day advances; the VWAP eases back down.
The explanation behind the slowing down toward the day’s end is because it takes in so much data that price variation toward the end of the trading day does not influence its movement.
Volume is of the Essence
Above all, VWAP recognizes the liquidity of the market. The more fluid the market is, the more prices move and the more VWAP moves around as well.
The primary concern is that the VWAP is an indicator that traders know about if they are hoping to take a considerable position in any specific stock. It is important to recognize that the VWAP is not an infallible indicator; as a matter of fact, patterns and other best metatrader indicators are rarely dependable, yet they are significant for monitoring.

Conclusion On VWAP Bands
The VWAP Bands is a combination of both price and volume; as a result, it provides valuable information, in comparison to traditional moving averages. Although it is a highly an under-used package, it could come handy for traders seeking to make the best worth out of the market while also trading large volumes.
The limitation of VWAP as an indicator mostly for intraday traders, notwithstanding, with the right approach, it can be an invaluable tool for profit maximization. Furthermore, you could find plenty of more tools and indicators through our website to help you generate even higher returns.