
Top 3 Popular Trend Indicators
Welcome to another article on our best forex indicator website. Like any other entrepreneur, Forex traders are constantly on the lookout for the best way to make a reasonable profit in business. Trend trading is one of the most sought-after strategies in the forex world. In order to do so, here in this piece, we will talk about the top most popular Trend Indicators.
It is important to mention that trend trading goes beyond simply buying when a stock is rising or selling when it is falling. Successful trend traders depend mostly on technical indicators to measure the strength of any trend that they intend to trade on.
Out of a large number of indicators out there, the top three popular trend indicators are discussed below.
Table of Contents
Moving Average Convergence Divergence (MACD)
The moving average convergence divergence is a form of oscillating indicator. It is a technical analysis indicator developed in 1960 by Gerald Appel.
It was founded on the comparison of fast and slow exponential moving averages. While it is widely argued that MACD is used to identify fluctuations in stocks and indices. And so can be used to make market decisions. Hence, can easily be called amongst the most popular trend indicators.
How it works
The first stage to obtain the MACD Indicators is to graphically represent a slow and a fast exponential moving average (EMA) of closing prices. Characteristically, the method adopts a 12 and 26 day period. The 12-day exponential moving average, which is shorter, offers more weight to recent prices than the 26-day measure.
While the next stage is to compute and plot the difference between the two exponential moving averages; MACD = EMA (12) – EMA (26) graphically. You then apply a smoothing by calculating and charting a Signal line. To achieve this, you take an additional exponential moving average of the MACD line.
The conventional method is to use a 9 period EMA. Hence; Signal line = EMA (9) of MACD. Finally, the difference between the MACD line and the Signal Line is calculated. And the typical approach is to plot the MACD and signal lines on top of a histogram signifying the difference between the two.
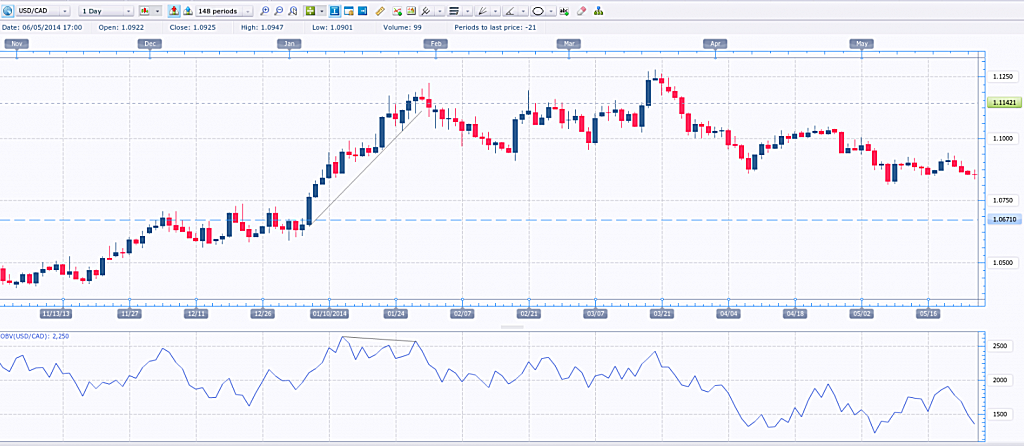
In the chart below the top section shows the actual prices with the 12 and 26 period EMA lines overlaid. There are some good Top 10 MT4 Indicators out there. We advice to do your own research always!
Three common MACD trading strategies
The range of MACD strategies that can be used to find opportunities in markets include:
Crossovers
The Moving Average Convergence Divergence line and signal line can be used in the same way as a stochastic oscillator, with the crossover between the two lines producing buy and sell signals.
Like most crossover tactics, a buy signal arises when the shorter-term, more responsive line which is the MACD line, intersects the signal line from above. In contrast, when the MACD line intersects the signal line from below, it offers a bearish sell signal.

Histogram reversals
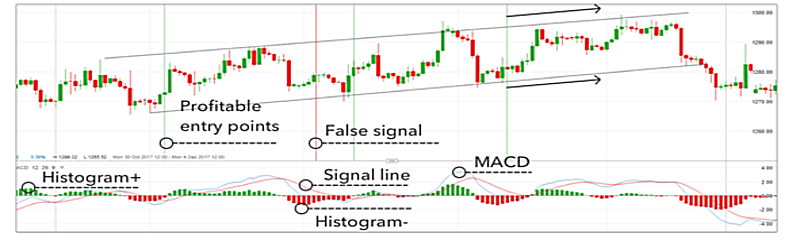
This is about the most important part of MACD. The bars represent the difference between the MACD and signal lines. When the market price moves strongly in a direction, the histogram increases in height. And when the market moves slowly, the histogram contracts.
It is a major strategy, compared to the lagging crossover strategy discussed above. The histogram reversal is predicated on applying known trends as the basis for placing positions, making it possible to execute the strategy before the market movement occurs.
The chart below indicates the potential use of the MACD histogram as a trading tool.
Zero crosses
This strategy is founded on either of the EMAs crossing the zero line. If the MACD intersects the zero line from below, a new uptrend may be evolving. And when the MACD intersects from above, it signifies that a new downtrend may be emerging.
On Balance Volume (OBV)
On Balance Volume (OBV) was designed by Joe Granville and familiarized in his 1963. It estimates buying and selling pressure as a cumulative indicator, summing up the volume on up days and subtracting same on down days. Hence, it is a vital indicator which takes a significant amount of volume information and accumulates it into a single one-line indicator.
Usually, the volume should confirm trends. A rising price should follow a rising OBV; a falling price should also accompany by a falling OBV. It is considered in the industry as one of the best as one of the most sought-after momentum indicators.
Divergences
Like most divergences, the OBV can help indicate which direction a price breakout is likely to occur by relying on bullish and bearish divergence signals. These signals work based on the concept that volume precedes prices.
A bullish divergence develops when OBV moves higher or creates a higher low even as prices move lower or creates a lower low.
While a bearish divergence forms when OBV changes to lower or develops a lower low as prices move higher or create a higher high. The divergence between OBV and price should indicate to chartists that a price reversal is probable.
 Bullish Divergence
 Bearish Divergence
In a situation where the price gains a new peak and the OBV records a new peak, the bull trend will continue expectedly. The same scenario plays out when the price reaches a new bottom. At this point, a trader would feel secure, if he/she enters in the direction of the trend, which is established by the OBV. TIP: Do not forget to read our Supertrend indicator MT4 article that we published few time ago.
The Relative Strength Indicator
With the name “relative strength” many believe howbeit, erroneously that you are comparing two markets; however, the RSI compares the market you have chosen to itself.
The RSI compares the strength of up days to that of down days and using the computation; a trader can identify if the current momentum is bullish or bearish. It is a bounded momentum oscillator that swings between a top-level of 100 and a bottom of 0 which permits traders to apply it as an overbought and oversold indicator. With the typical settings to measure the OB/OS of an instrument are 80/20; where 80 is overbought and 20 is oversold, and 70/30, where 70 is overbought and 30 is oversold.
One downside of the RSI is that abrupt, sharp price movements can result in spike repeatedly up or down; therefore, it is susceptible to giving false signals. However, if the spikes or falls indicate a trading validation in comparison to other signals, it could signal entry or exit point.
The RSI oscillates using a computation that collates the relative strength of gains in the price of days that close above previous days close to the price loss on days that close below previous days close. RSI Computation = (100 – (100 / (1 + U/D) We have written even a special article with the best indicators for intraday trading.
Conclusion on Popular Trend Indicators
So then, these are the Popular Trend indicators. Without doubt are valuable tools in forex trading; however, it is important to combine trend indicator mt4 with other tools based on the trader’s assessment. Besides, before adopting any, you should also ensure that you have fully tested your trading strategies.
Furthermore, you can scroll through the platform via this link to find more tools and indicators to use for trading better.