
The Complete Guide to Island Pattern
Island Pattern is a price pattern on candlestick charts or bar charts. Every day, the chart features a group of days. The group is separated on either side by price action. An exhaustion gap causes the separation while a breakaway gap triggers the next movement in the opposite direction.
Understanding the pattern and associated gaps will put you in a better position to have a good shot at becoming a successful trader.
The price pattern passes a message: trend reversal is possible. Prices may reverse the current trend the charts exhibit. The reversal may be in either direction, downward to upward or from upward to downward. The trend reversal can be bullish or bearish.
Table of Contents
What is a Gap?
An interval or an unfilled space in the group of days is referred to as a gap. This represents an area on a technical analysis chart where there is no trading for a specific period.
A trend is considered upward if a day’s highest price is lower than the following day’s lowest price. A gap is also formed. The reverse is the case in a downward trend. In this trend, you have a gap when a day’s lowest price is higher than the next day’s highest price.
For instance, if a share’s price hits $44.50 on Monday and opens at $46.50 on Tuesday but falls to $45.00 before appreciating to $45.50 again, a gap will appear on the chart as a no-trading zone if there no trading between $44.50 and $45.00.
If you can spot a gap before starting a move, that will be hugely beneficial to your trading activity. You can base your trading on that information and other related ones to help you trade wisely.
Types of Gaps
In Island Pattern, there are two major gap types. These are exhaustion and breakaway gaps.
Breakaway Gap:
Prices of shares may break away from an area where there is congestion. If the breaking away is from a triangle, either descending or ascending, with a gap, that’s a breakaway gap. As a trader, you should expect a strong change in sentiment when the breakaway gap appears. A powerful move is imminent too and you should be on the lookout for that.
Always keep your eyes on the volume. Paying attention to the volume will enable you to determine its weight after the gap is formed. If you notice a heavy volume after the formation, the market will probably not return to its normal position to fill the existing gap.
However, if the breaking away occurs on a low volume, prices will only resume their trend after the gap has been filled.
Exhaustion Gap:
The exhaustion gap passes a message: a move has just ended. The gaps are usually accompanied by a straight-line decline or advance. When the gap is formed with heavy volume at the top, the market is probably exhausted. Look out for the prevailing trend because it is at a halt at that moment. An exhaustion gap isn’t a major reversal and shouldn’t be treated as such.
A common feature of island reversals is a cluster of prices. The cluster may cover different time frames, from a couple of days to several months. You have gap patterns when there is a price difference between two days.
Two white candlesticks will form gaps up. One of the candlesticks will show an opening price higher than the closing price for the previous day.
You will have a gap down with two red candlesticks if one of the candlesticks shows an opening price that is lower than the closing price for the previous day. As a trader, watch out for these gaps, especially those that close and open an island reversal pattern.
A breakaway gap will support the island reversals to start the island grouping. An exhaustion gap will follow to signify the end of the formation. When the exhaustion gap appears, that’s an indication of the occurrence of a new trend. The new trend will include a couple of runaway gaps that are formed in the new direction, another exhaustion gap will follow.
Types of Reversals
There are two types of Reversal. These include the bullish reversal and bearish reversal.
1. Bullish Reversal
In the bullish island reversal, you have a downtrend market. There is also a negative gap, indicating the start of the pattern. The market will start consolidating or continue its downward movement as soon as the gap is formed. While this goes on, the gap zone doesn’t change but remains intact.
The reversal may affect the price. It may peak temporarily. Shortly after, it will recede quickly. Don’t miss any of these changes.
When the market trades below the gap and forms a group of price actions, a positive gap is produced. This may occur at the price level where it formed the first gap or close to the level.
2. Bearish Reversal
Bearish reversal is the opposite of the bullish reversal and it indicates a market in an uptrend position. A significant positive gap gives a clue into the reversal type.
In bearish reversal, the market may consolidate or move upward while the gap remains the same. Note that the gap zone won’t close immediately. Somewhere around the first gap, a bearish gap occurs.
The bearish island reversal is the more common of the two. This reversal is usually charted over a couple of days or weeks. A significant upward move precedes it. When it occurs, the stock price runs high. The increased price triggers an island reversal pattern. It then makes its upward high movement before making another island reversal.
The big question is how do you identify when a bearish Island Reversal pattern appears during a bullish trend and vice versa?
How to Identify a Bullish Island Reversal Pattern
Identifying the moment when a bullish pattern appears to turn a bearish trend around is pretty simple. First, study the market and notice where there is a downtrend. Around the downtrend, a negative gap exists that signals the start of a change or reversal.
Once you identify the gap, notice the market’s behavior. Is the market consolidating or does it continue its downward movement? Then, consider the gap zone too. The gap zone must remain intact while an upward movement forces the price into recession.
A positive gap is generated after you have traded below the gap for a period and price action is forced. The positive gap will appear close to the price level or at the price level where you first saw the gap formed.
Identifying Bearish Island Reversal
You shouldn’t have issues identifying a bearish Island Reversal as well. Two major characteristics of a bearish pattern are a significant positive gap and market uptrend. First, study the market and see whether it is consolidating or continuing an upward movement.
Irrespective of the market’s status, it won’t fill the gap. More so, the gap zone won’t be filled immediately. When you notice all these, you have a bearish trend around the first gap.
Attributes of an Island Reversal
Island Reversal has some unique characteristics that can help you identify it. Some of these attributes are:
- An Island Reversal rarely occurs.
- Island Reversal consists of a minor move and it isn’t a major significance itself.
- You can find it at the top or the bottom.
- The gaps at both ends of the reversal occur at almost identical price levels.
- The reversal has a trading compact. The compact is separated from the next move which will occur in the opposite direction.
- The reversal is a very good indicator of an intermediate trend’s or primary trend’s reversal.
- When it appears, it signifies the occurrence of a huge change in the sentiment.
- In the compact trading area, expect high volume.
- The trading activity may be short or long, lasting for a single day or some days. One-day reversal is the common term for a trading activity that lasts for just one day.
As you can see, this pattern indicates a movement that will exist in the opposite direction of the current movement. As a trader, you can exploit this information when trading. Your ability to determine the next movement will reflect on your trading skills.
However, the Island Reversal candlesticks pattern is a short-term pattern. Thus, you must understand how it works and use it with caution. It is also not a common pattern, another reason why understanding how it functions is important before incorporating the pattern into your trading.
When they occur, you must act swiftly to take advantage of the pattern. For instance, if the Island Reversal occurs at the top, that’s a selling signal. Otherwise, if you identify it at the bottom, a buy action is signaled.
However, to get the best out of the pattern, don’t use it in isolation. Its poor performance results and infrequent concurrencies make it an unreliable pattern that shouldn’t be used alone without other trading strategies.
How to Trade Island Reversal Patterns
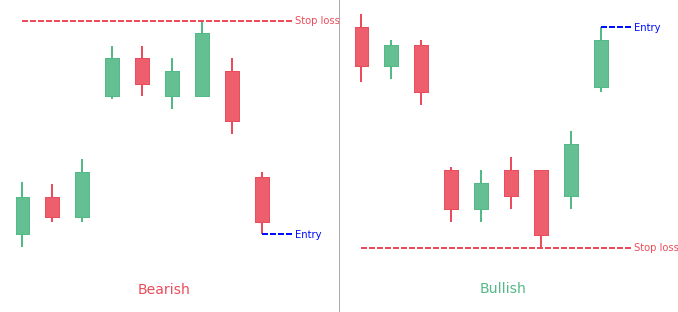
Understanding how to trade island reversal patterns is crucial to your success. Here are some selling rules you should incorporate into your trading strategy:
- Start by identifying the bearish pattern. Look out for the characteristics of this pattern discussed above.
- Use a market sell as soon as you identify the bearish gap form. However, you may decide to wait a bit and study the candlestick. Place a pending sell stop order on the candlestick when it closes.
- Place your stop loss beside the bearish gap.
- You should go for risk and reward in the ratio 1:3. Alternatively, target the previous swing low.
How to Buy Bullish Island Pattern
- The first step is to identify the bullish Island Pattern.
- Study the candlestick and sell stop order once it makes a bullish gap. A market order is an alternative for this purpose. If you wish, wait for the candlestick to close first before using a buy stop pending order.
- On the bullish gap’s other side, place your stop loss.
Helpful Trading Tips
As a trader, you can apply some trading tips to help you use the island reversal pattern better. The following tips will increase your chances of making a profit when using the trend:
- Observe the market volume. This will give you an insight into the pattern’s usefulness. Pay attention to the volume and see if it is decreasing or increasing. If the volume is increasing, expect an upcoming trend reversal. Experts ascribe more weight to reversal signals formed when the market volume increases.
- You can also get insight into the Island Reversal pattern’s usefulness if you pay attention to the size of the formed gap. The last gap, bigger than the first, is of more importance, according to technical experts.
- A helpful piece of information to consider when using this pattern is the Island’s length. Although it may take some time for an Island to form, market participants most often don’t detect too long islands. Thus, the rule of thumb is to overlook Island Patterns that are longer than three months.
Closing Remarks About Island Pattern
Simply put, the island Reversal candlestick pattern occurs when the market moves in a certain direction. After the movement, a gap is formed in the movement’s direction.
If there is an upward movement, the gap will be upward as well. Expect a downward gap movement during a market’s downward movement too. Regardless of the movement direction, the pattern occurs for a short interval, announcing an imminent gap formation in the opposite direction to the pattern. Understand bearish and bullish trends as well. Knowing what triggers a reversal will help you identify the current trend and the expected trend.
Don’t forget the helpful trading tips as well. They will help you to trade with confidence regardless of your years of experience in the trading business. Furthermore, you can browse through the platform through this link for more such indicators and tools.
Finally, always remember that you can’t use Island Patterns in isolation. Study other trading strategies that can complement these patterns and incorporate them into your trading.