
Best Candlestick Pattern Indicator
What is the Best Candlestick Pattern Indicator? Finding ways to analyze the market or to understand the trending is never easy, especially when it comes to determining the potential price points to enter a position. The candlestick pattern indicator comes handy in this regard. It is a must-have tool for all traders regardless of experience level.
Just like other technical indicators on the market, it can be risky using candlestick pattern indicators in isolation. However, they are useful when you need to determine support and resistance levels, the price point to enter a position, as well as other technical signals. With these best metatrader indicators, you can get a currency pair price point in real-time.
In this article, we will walk you through everything you need to know about the candlestick patterns, benefits of using them, how to install candlestick patterns on your MT4 trading platform, and conclude the post by highlighting the best Candlestick Pattern Indicators from which you can choose. Let’s begin then:
Table of Contents
What Are Candlestick Patterns?
If you are an experienced trader, you may have come across candlestick charts in the course of your trading. A candlestick chart is a type of chart that changes in color whenever there is an upward or downward change in the open price. That said, candlestick patterns are those patterns you see on the candlestick chart. It occurs because of market sentiment following the activities of buyers and sellers.
They typically depict the market trend and tell you who is in control of the market at a particular time of the day. Plus, they are usually repetitive. When there is a change in price, a specific pattern will occur on the candlestick chart.
The upward and downward changes in price are captured in the candlestick chart based on the upper and lower wicks on the chart. While there are different charts available for traders to analyze the price of a currency pair, the candlestick chart stands very tall because it is very popular among traders. Here are other types of charts on the market:
- Renko charts
- Line chart
- Bar chart
- Kagi charts
- Point and figure charts
- Three line break charts
Who Developed The Candlestick Charts?
In the 1800s, Rice traders developed the candlestick charts in Japan. At the time, the traders wanted to trade at the Dojima rice exchange, so they needed a chart time to enable them to make a profit.
Before the evolution of candlestick charts, traders were left with the option of using either bar charts or line charts. If you know how to read the candlestick charts, you would have full confidence when trading on the forex market. When it comes to technical analysis of the market, even though the candlestick charts are very old, they are still useful in the present-day market. TIP: Read our mt4 spread indicator article and see how this can increase your trading skills.
Benefits of Using Candlestick Patterns to Trade
There are several benefits of using the candlestick pattern indicator to trade. Some of the benefits include:
- Will complement your trading strategies
- It helps you identify loopholes where you are likely to suffer a loss.
- It can help you identify the entry and exit point of a trade.
How to Install Candlestick Pattern Indicators
The first step of installing the candlestick pattern indicator on the MT4 trading platform is to download the indicator from any reputed site. Once downloaded, you can add it to the MT4 platform. You can follow our “How To Install Indicators On MT4” guide to do the installation. After you have successfully installed the indicator, you can then drag and drop or copy and paste the indicator to the chart.
Screenshot here
You can configure the settings via the configuration window. Once you do the configuration, the selected candlestick pattern will get to work. You will begin to see the upward and downward movement of the open price on the chart.
Screenshot here
The candlestick pattern indicator will automatically plot the patterns as soon as there is a price change. It’s designed to notify you whenever there is a price change. That means if you install the indicator on several charts, you will be flooded with several notifications.
The only major drawback of using this indicator is that it doesn’t identify the point that the candlestick pattern occurs. Therefore, it is recommended that you don’t use candlestick patterns in isolation. You can activate other technical indicators like support and resistance Indicators, as well as trend analysis.
The Best Candlestick Pattern Indicators You Should Consider
There are several candlestick pattern indicators out there. Unless you are an expert, you may make mistakes when choosing a candlestick pattern indicator for your trading needs. So, which candlestick pattern indicator should you choose? Here is our choice of the best candlestick pattern indicators.
#1. The Doji Candlestick Pattern
The Doji Candlestick Pattern is a leading indicator among traders. It is represented by long upper, lower wicks, and a small body. The open and close prices of trade are usually represented with the body of the indicator. The Doji pattern appears immediately there is a strong trend. Once it appears on your chart, you should expect the price to post for a correction. However, do not expect the Doji pattern at all times to be a reversal pattern.
Often time, we have heard traders assert that after a Doji pattern occurred, they were shocked to see the price moving continually in the previous direction. Therefore, it is essential to pay attention to the exact spot that triggered the Doji pattern in the first place.
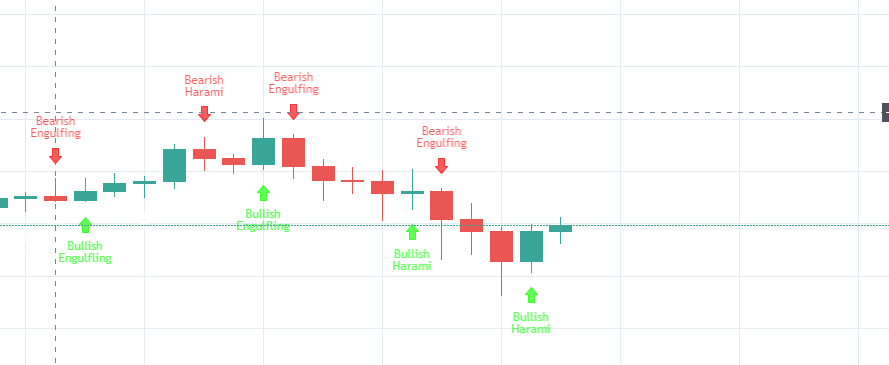
#2. The Engulfing Pattern
The Engulfing pattern is another widely used Candlestick pattern indicator considered to be the best for forex trading purposes. Used mainly to determine the bullish and bearish patterns of the market, it is formed the moment the candlestick closes bearish or bullish on the right. It engulfs the entire candlestick on the left. This indicator is relatively good, depending on the close of the market.
#3. Morning and Evening Star
This is another popular one. Considered as on of the best candlestick pattern indicator, you need them if you intend to make continuous profits on the market. The morning and evening star is formed when the price gaps are lower or higher. If you use a chart that you don’t regularly see a gap, there is a high chance that you won’t get to see the morning and evening star indicator. This situation is prevalent when you are dealing with stock trading.
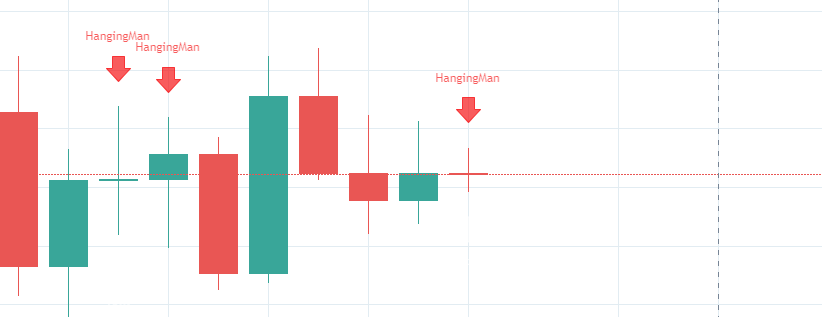
#4. Hammer and The Hanging Man
The list would not be complete without mentioning these great reversal patterns indicators. The hammer and hanging man occur when there is a reversal in the market trends. They either occur at the top of an uptrend or the bottom of a downtrend, just as their names suggest.
Conclusion Candlestick Pattern Indicator
If you are not so good when it comes to market analysis and reading market trends, the candlestick pattern indicator is a tool to leverage. It is easy to download and install, plus, it can help you determine price points to enter or exit a position.
Meanwhile, there are other trading tools available on this site for your convenience. You can discover them through this link. It will help increase your earning potentials.