
How To Effectively Trade Forex Butterfly Pattern

The forex market is one of the most liquid and fast-paced financial markets in the history of mankind. Succeeding in the market requires in-depth knowledge of how the market operates, your ability to use trading tools, as well as your ability to be disciplined and patient. And this is where the Butterfly Pattern can be useful.
Another requirement to succeed as a forex trader is to equip yourself with the skills of reading patterns. Pattern reading contributes significantly to the success of experienced traders. While there are different patterns that traders can learn to improve their trading experience, harmonic patterns appear to be the most important. The most prominent harmonic pattern out of all of these is the butterfly chart pattern.
Harmonic patterns are popular patterns that traders rely on to take profit and achieve their profit projection. At its core, harmonic patterns tend to predict the direction of the market and future price movements. They exist in two categories – internal and external harmonic patterns. While external patterns consist of the butterfly and crabs, the internal pattern is composed of Gartley and bat.
In this article, we will x-ray what butterfly patterns are, how they work, and how traders can use them to make the most out of the forex market.
Table of Contents
Butterfly – What Does It Mean?
Put simply, butterfly are a reversal chart pattern that shows price consolidation and can be traded at all time. Traders would usually notice these patterns after an extended price movement. Some traders may also see it in Elliot wave terms once the last wave of the impulse sequence stops displaying. Forex traders can use butterfly chart patterns to determine the start of a new trend phase, the start of a new correction, or at the end of a trending position or move.
While butterfly patterns can be traded at all time, most traders prefer to trade it at higher time frames. The structure of the harmonic patterns looks much like the Garley 222 patterns. However, the former has the advantage of buying and selling even at new highs or lows. This is because one of the waves, referred to as Wave D, usually terminates above where Wave XA starts.
Butterfly patterns were first discovered by the duo of Larry Pesavento and Bryce Gilmore. It predicts a reversal and forms close to the highs and lows of the FX market. It has four legs, including X-A, A-B, B-C, and C-D.
Now you know what it is. Let’s move to how do you identify them? Here is how:
How To Spot Butterfly Chart Patterns?
We mentioned earlier that butterfly chart patterns appear like the Gartley and Bat patterns, but come with 4 legs – A-B, X-A, B-C, and C-D. These four legs inform FX traders of the exact time to place a sell order when the pattern comes to an end.
Let’s take a look at each of the Butterfly pattern’s four legs.
A-B
This is the butterfly pattern’s leg that notices when price changes direction. The leg immediately retraces by 78.6% of the total distance covered by the X-A axis.
X-A
This is the first leg that forms in the butterfly pattern’s bearish version. This leg forms as soon as there is a price decline from point X to A.
B-C
In this leg, the price switches direction the second time and retraces between 38.2% and 88.6% of the total distance covered by the A-B axis.
C-D
This is the most important leg of the pattern. As with Gartley and Bat, there is the AB=CD structure to complete the pattern. However, the C-D leg extends to form a 127% version of the A-B leg. For traders, the best time to enter the market is at point D. The difference between the butterfly and the Gartley or Bat patterns is that most traders prefer to open a trade position at the point where the C-D leg reaches a 127% version of the X-A leg. What’s more? C-D is the longest leg of the pattern.
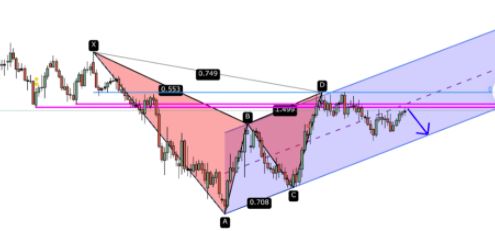
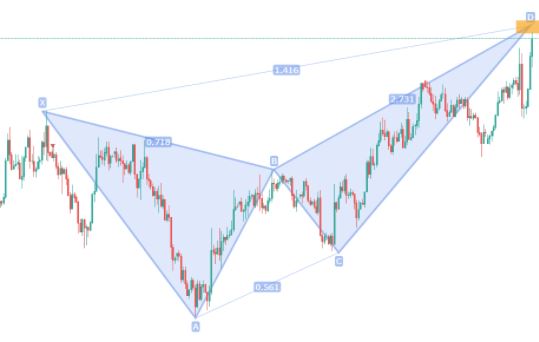
Butterfly patterns’ presence on the chart appear like the letter “W” in uptrends and “M” in downtrend. If care is not taken, one can mistake it for a double top or double bottom pattern during the formation of the pattern.
What Information Does The Butterfly Pattern Pass To FX Traders?
The Butterfly Chart Pattern is an important pattern that traders can use to maximize their stay on the FX market. The creators of the pattern have repeatedly asserted that the Butterfly chart Pattern can display the important lows and highs of a trend.
If you analyze this pattern under various time frames, the chances are that you will see different patterns towards the end of the trend. The different patterns you will see are what is known as “extension patterns.” They are usually formed when the CD wave invalidates the Gartley pattern when passing through X.
The Butterfly Pattern can either be bullish, which we usually advise traders to place a buy order, and bearish, the point we encourage traders to place a sell order. The butterfly chart pattern allows traders to get rid of errors; as such, care must be taken when applying this pattern.
How To Effectively Trade It
Before you attempt trading the butterfly chart pattern on a live account, we encourage you to first use a demo account so that you understand how it works, when to place a buy order, and when to close your trade to make profits.
When you are ready to use a live account, kindly confirm that the pattern is real before opening any trade position. A real butterfly chart pattern should have these vital elements:
1. AB: 78.6% of XA leg
2. BC: The BC leg should be 38.2% and 88.6% minimum and maximum Fibonacci retracement of AB leg.
3. CD: The CD leg should be 1.618% to 2.618% of AB leg
Entry point
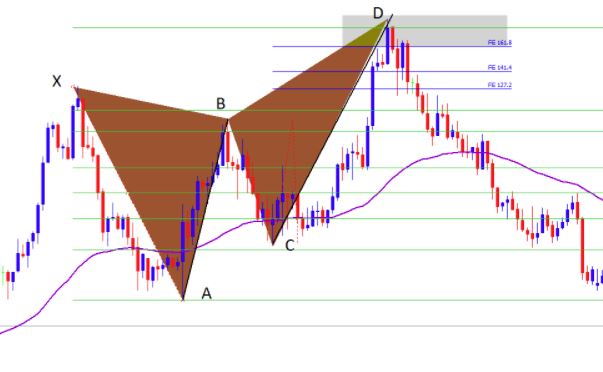
For the entry point, find out the exact spot where the pattern will stop at point D. This is usually at 127% extension of the X-A leg.
Stop-loss
A stop loss should be inserted at 161.8% extension of the X-A leg.
Take Profit
Where you place your “take profit” depends on the market and your trading objectives. But if you need an aggressive profit, your best bet is to insert your take profit target at point A. Similarly, if you need conservative profit, then place the take profit at point B.
Now you know what to look up for to determine a real butterfly pattern. Let’s now walk you through how to trade the pattern during a bearish market.
The first step is to place a sell order at point D or at 127% extension of the XA leg. Once you are done with that, position your stop loss above 161.8% of the AX leg. Then place your take profit target at B for defensive move and A for aggressive profit target.
What about during a bullish market? Let’s also show you that. Place a buy order at the end of the pattern, precisely at point D. Also, place a stop loss below the Fibonacci extension or at 161.8% of the XA leg. Thereafter, insert your take profit at A and B as in the case of a bearish market condition.
Conclusion on Forex Butterfly pattern
Okay, that’s it. You can see that the Butterfly pattern is a great pattern to behold. It can help you take profit and achieve their profit projection. The butterfly patterns tend to predict the direction of the market and future price movements.
Whether you are a newbie or an experienced trader, do not underestimate the power and efficiency of the butterfly patterns. If you are looking to determine the end of a price movement, you can use this analysis tool to achieve that with ease.
If used effectively, the butterfly chart pattern has high accuracy. But before you trade this tool using a live account, we always emphasize practicing with a demo account. You have nothing to lose using a demo account. But if you make mistakes while in a live trading environment, it may cost you your trading capital, and that’s what we look to avoid.
You can also find more tools and indicators on our platform, so you may scroll through the site from this link and choose more tools to help you with trading.