
Best Indicators For Intraday
What are the best indicators for intraday? Every trader seeks better ways of understanding the market and maximizing profit: the very reason why we have a lot of trading indicators in the market.
Intraday trading indicators are tools that provide vital information on best trading strategies and maximization of returns. To earn maximum profit from the market, you need to use the best indicators for intraday. On our website you can find a list off the Best Metatrader Indicators also.
Table of Contents
Why Is Intraday Indicator Very Important?
1.Direction and movement of trends
The Intraday indicator shows the market’s movement or directions explicitly. Usually, the Oscillator trend indicators are concerned with movements between high and low values.
2.Prevailing momentum within the market
Momentum indicators show the strength and points of the trend. It also indicates whether there are chances of reversal. Well-known momentum indicators include the Relative Strength Index (RSI) and Stochastic Oscillator. They signal top and bottom prices.
3.Volume Measurement
Volume indicators show the changes in volume with time. When there is a change in price, the volume indicator indicates the strength of the movement. An example is the On-Balance Volume indicator.
4.Prospective profit as a result of volatility
Volatility is an essential indicator that shows changes in price within a period. High volatility signals big price moves while lower volatility indicates small price moves.
The Best Intraday Indicators
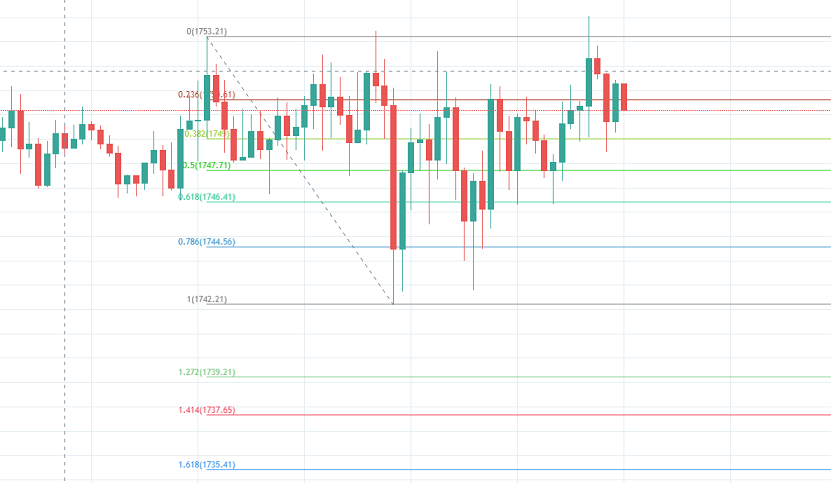
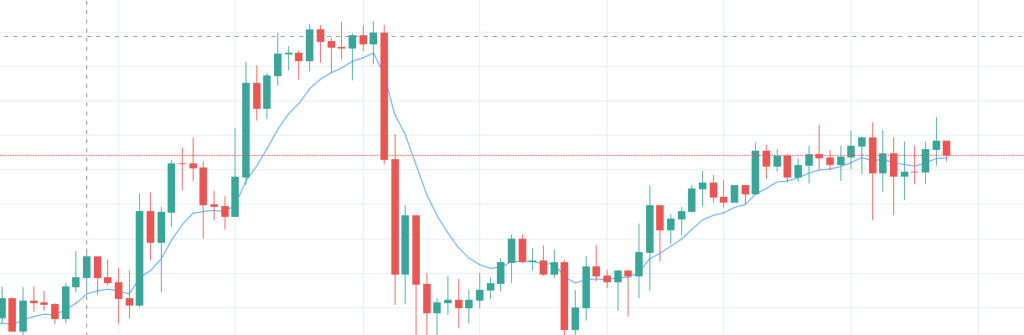
1.Moving Averages
The Moving Average is a very popular trend trading indicator. MA is a stroke on the stock chart that joins the average closing rates within a period. When the long term averages are less, the trend of the market is bullish. A bearish market trend occurs when the short term averages are less. MA is worth its reputation as one of the best indicators for intraday traders.
What is The Moving Average used for?
With the help of the Moving Average Indicator, traders can ascertain:-
- The up and down movement of the trend.
- The reversal of the trend.
- The stop loss and trailing stop loss points.
- Whether the price has been overextended.
MA Buy Signals
- Moving Average array should be in ascending order.
- It has to be virtually parallel and at the same distance.
- At the bottom, you will find the lowest Moving Average while the top is for the highest Moving Average.
- The first signal comes up when the price cuts the short Moving Average from the bottom.
MA Sell Signals
- Moving Average array should be in descending order.
- It has to be virtually parallel and at the same distance.
- The first signal comes up when the price cuts the higher Moving Average from the top.
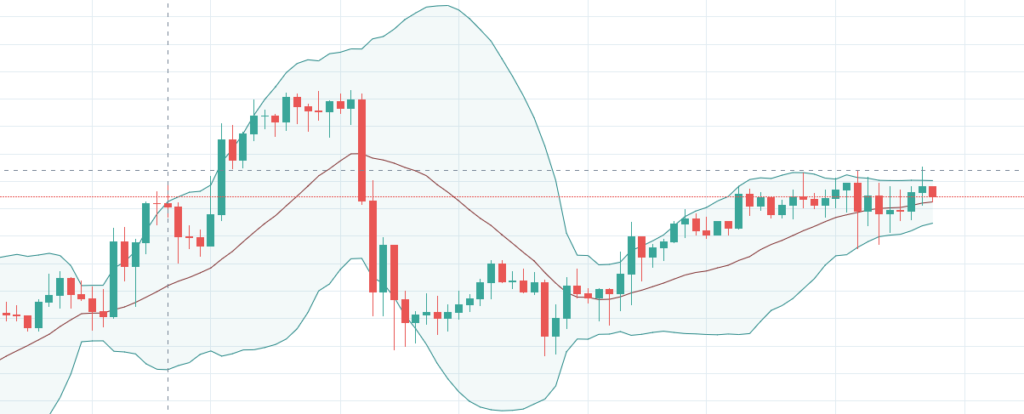
2. Bollinger Bands (B. Bands)
John Bollinger, an American author, established bands. It is aimed at helping the trader know the price range of a specific stock. The Bollinder Bands is a popular forex indicator. Many advanced traders trade this with a live currency strength meter.
Components of Bollinger Bands
This trading is a favorite and one of the best indicator for intraday traders.It makes use of three lines- the upper, the middle, and the lower lines. The trader determines the middle line/band signifies a 20-day moving average of prices and its parameters. The upper and lower bands are positioned on both sides of the middle line.
The distance between the upper and lower lines is calculated using standard deviation; (a +2 standard deviation and a -2 lower deviation, respectively). The price movement of a stock is usually amid the upper and the lower band. There are also some good Price Action Indicator MT4 that you can check.
Uses
- Prediction of the trend movement.
- Identification of reversals.
- It helps in gauging the volatility.
Buy and Sell Signals
- The demand and supply zones form around the asset’s price movement.
- When there is a price movement with higher volatility, the band widens. But with lesser volatility, the band decreases.
- When an asset is trading below the lower line, it indicates buying.
- When an asset is trading above the upper line, it indicates selling.
3. Relative Strength Index (RSI)
One of the best indicators for intraday is the Relative Strength Index (RSI), which is a very easy Momentum trading indicator that uses the technique of ‘buy low and sell high.’ It’s a single line with a value range of 0 to 100. RSI has its standard parameter as 14 periods and usually makes a price comparison between the Advancing period and Declining periods.
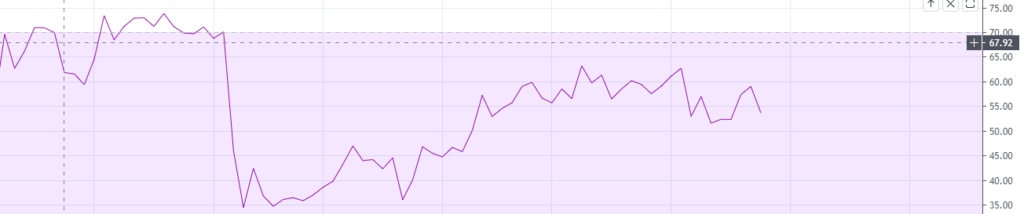
RSI indicates oversold or overbought market:-
- When RSI value ranges below 30, it’s ideal to buy (an oversold market).
- When the RSI value is above 70, it’s best to sell (an overbought market).
RSI estimates the market trend:
Every trader needs to be alert to be able to make analysis and ascertain the market’s direction.
- When the RSI is more than 50, it’s an uptrend in the market.
- When the RSI is below 50, it is a downtrend in the market.
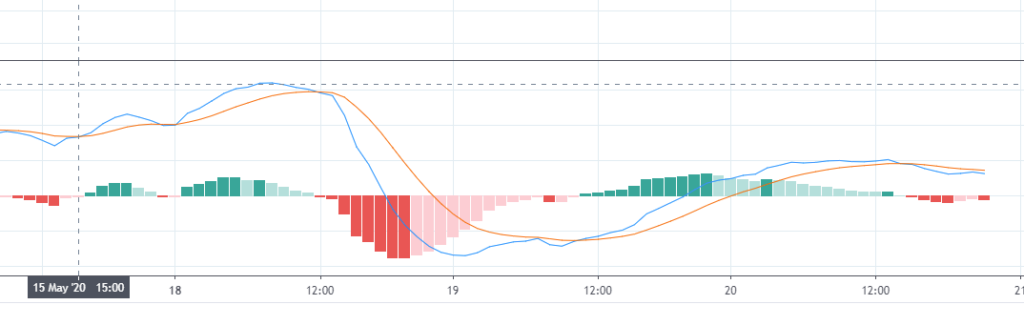
4. Moving Average Convergence Divergence (MACD)
The MACD is one of the most relevant Momentum trading Indicators for Intraday. It works principally on the convergence and divergence of two chart lines: the MACD line and the Signal line. You can use the MACD with several other popular indicators like the pin bar indicator.
Uses
MACD informs traders about:
- The momentum.
- The direction of the trend.
- Duration of the trend.
To plot the MACD line, calculate MACD Spread. That is the difference between the 26-day EMA (Exponential Moving Average) and the 12-day EMA.
From the MACD Spread, the value indicates the trend’s strength. A positive value indicates an uptrend, while a negative value indicates a downward trend.
Buy and Sell Signal
- With 9-day EMA, the second line, the Signal line, is plotted.
- When the MACD line stays above the Signal line, it signals to buy (a bullish trend).
- When the MACD line goes lower than the signal line, it indicates selling (a bearish trend).
5.Stochastic Oscillator
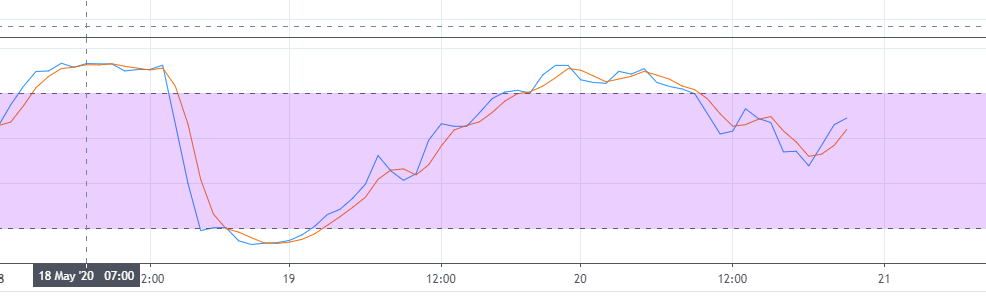
Another indicator to consider among the best indicators for intraday is the Stochastic Oscillator. The Stochastic Oscillator is one of the momentum trading indicators for Intraday. The oscillator relates a stock’s closing price to a variety of prices within a period. The momentum indicator does not chart price or volume but identifies levels overbought and oversold. It oscillates between two levels 0 and 100.
Levels below 20 are taken as oversold, while levels above 80 are seen as overbought. On some occasions, the trend’s direction may not be the same as the indicator’s suggestion. Traders are to make an in-depth technical analysis, together with acumens from other indicators, before making decisions.
The Bottom Line Best Indicators For Intraday
Intraday Indicators play an essential role in market analysis. They provide handy information on market trends and the best approaches to profit maximization. With the best indicators for Intraday, every trader is privileged to have planned-out strategies for trading and also avert certain risks.
Interestingly, here on the site, there are several tools that can be your 3th eye when doing Forex Trading because of the accuracy. So check it out on our best forex indicator website to effectively and carefully identifying trading opportunities.